



“Show our product's dispensing amount share against competing brands over the last 12 months”
Track market size, share and monthly trends for your products and their competitors.
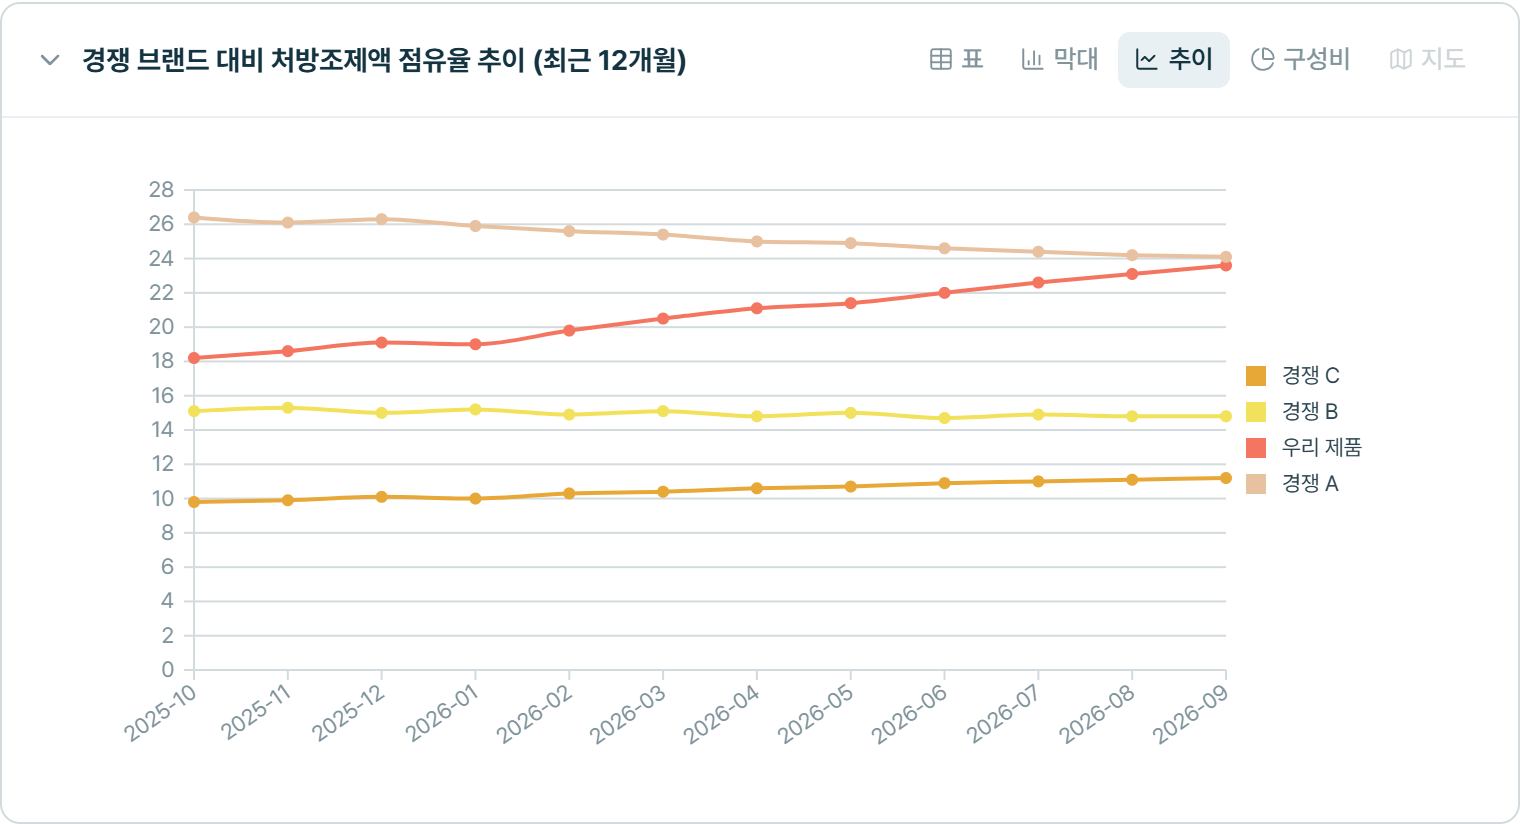
Figures shown are examples.
Put a metric, a period and the breakdown you want in one sentence. If something is unclear, PhAI asks back.
Figures shown are examples.
Type something like “Compare our product with three competing brands and show dispensing amount share over the last 12 months” and PhAI picks up the period and breakdown and runs the query. Change a condition in your next message and it re-runs with just that part changed.
Results stack up as chart blocks. Switching the same result between a table, bars, a trend or a share breakdown needs no new query.
Every chart block can be downloaded to Excel from its more menu. The screen draws only the top items, but the file holds the full data for the same query.
Where the data comes from
We collect dispensing records from pharmacies that hand out PillDoc medication guides and build national-scale statistics with our estimation algorithm.
The statistics provided through the PhAI service are estimates based on our own data collected from mandatory medication guides, applying our proprietary estimation algorithm.

“Show our product's dispensing amount share against competing brands over the last 12 months”
Track market size, share and monthly trends for your products and their competitors.
Figures shown are examples.
“List the top institutions by our product's prescription volume among general hospitals in southern Gyeonggi”
See distribution by region and hospital type to set visit priorities and ground resource allocation.
“Tabulate dispensing amount and month-over-month growth by ATC level 3”
Compare growth and competitive intensity by ATC and scan for promising areas.
Market competition, revenue ranking, regional distribution and prescribing patterns come as ready-made screens with their conditions set. You can keep asking the AI inside each one, and new libraries keep being added.

ATC 기준으로 시장 경쟁 구도와 점유 현황을 살펴봅니다.

월간 매출 상위 20개사의 순위와 변동을 비교합니다.
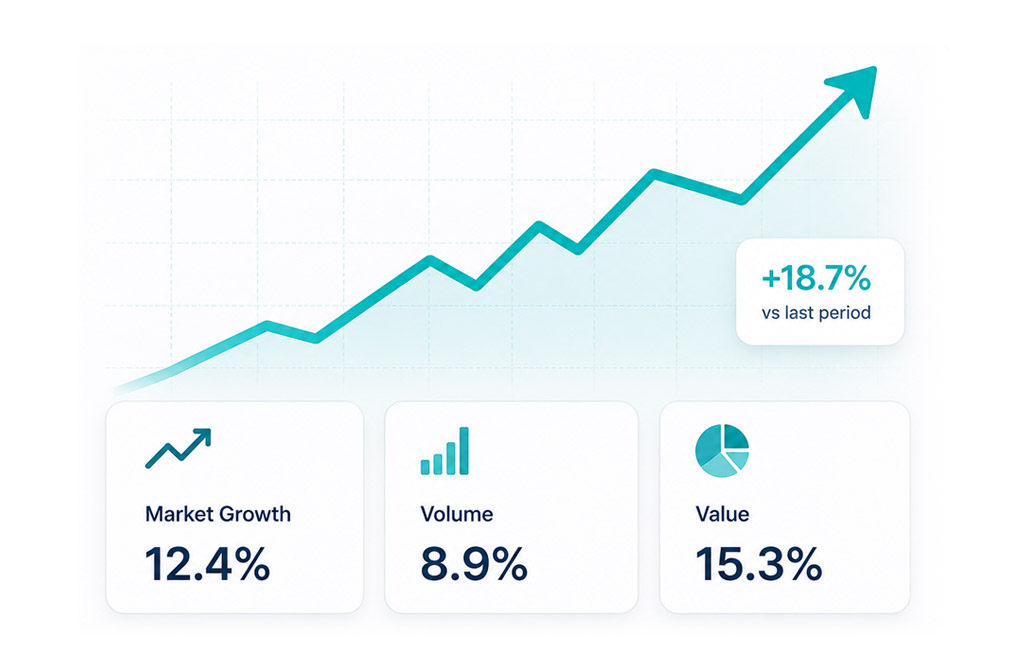
주요 시장의 성장·하락 트렌드를 한눈에 확인합니다.
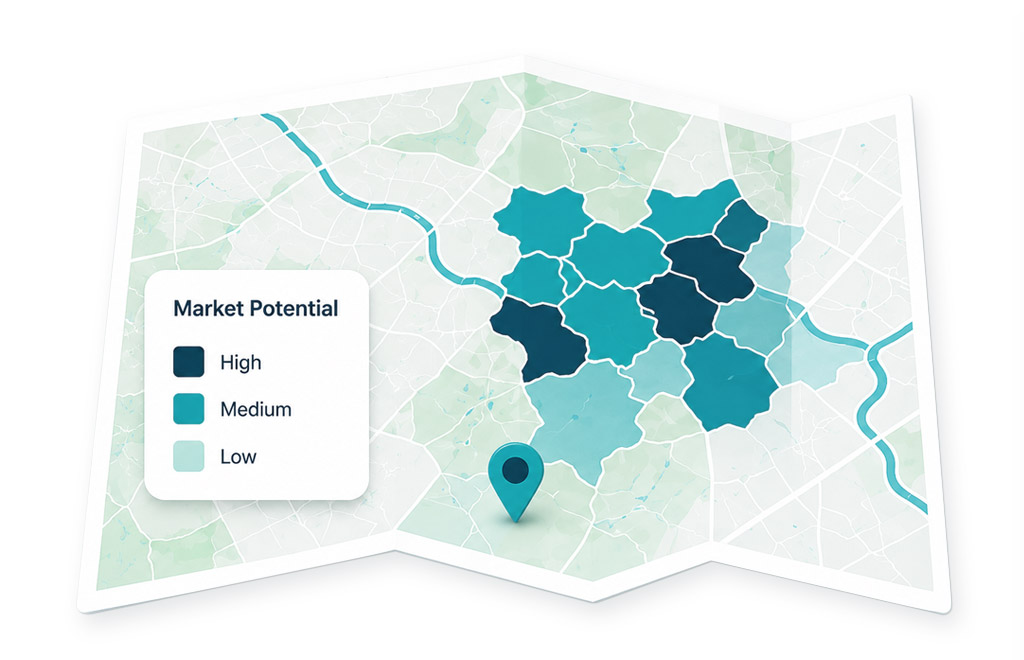
주간 지역별 처방 분포를 지도로 확인합니다.
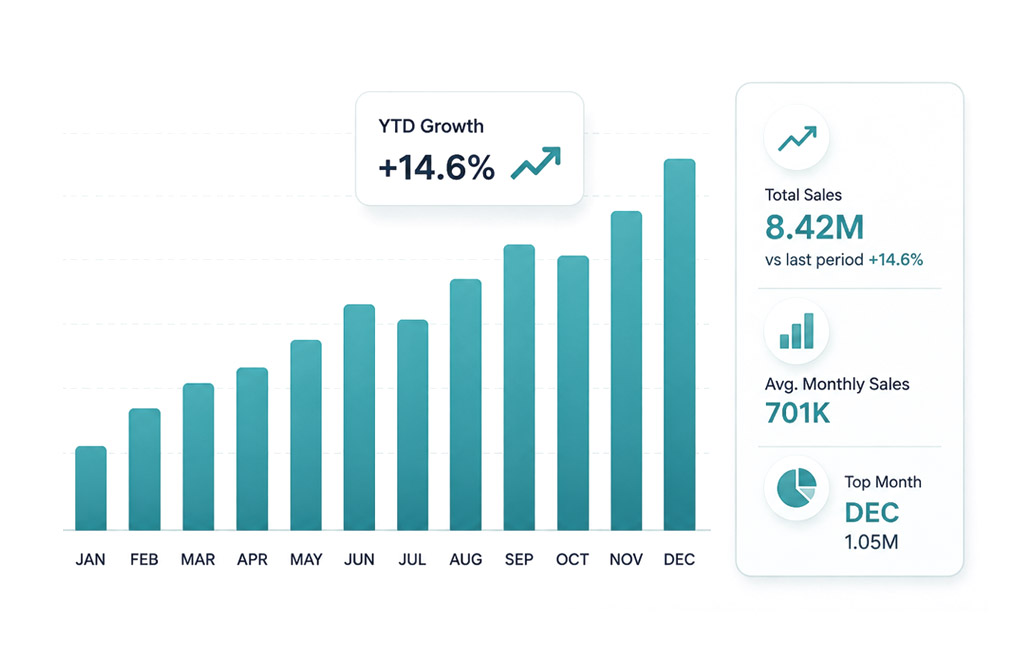
지표·기간·차원을 조합한 피벗으로 의약품 판매를 분석합니다.
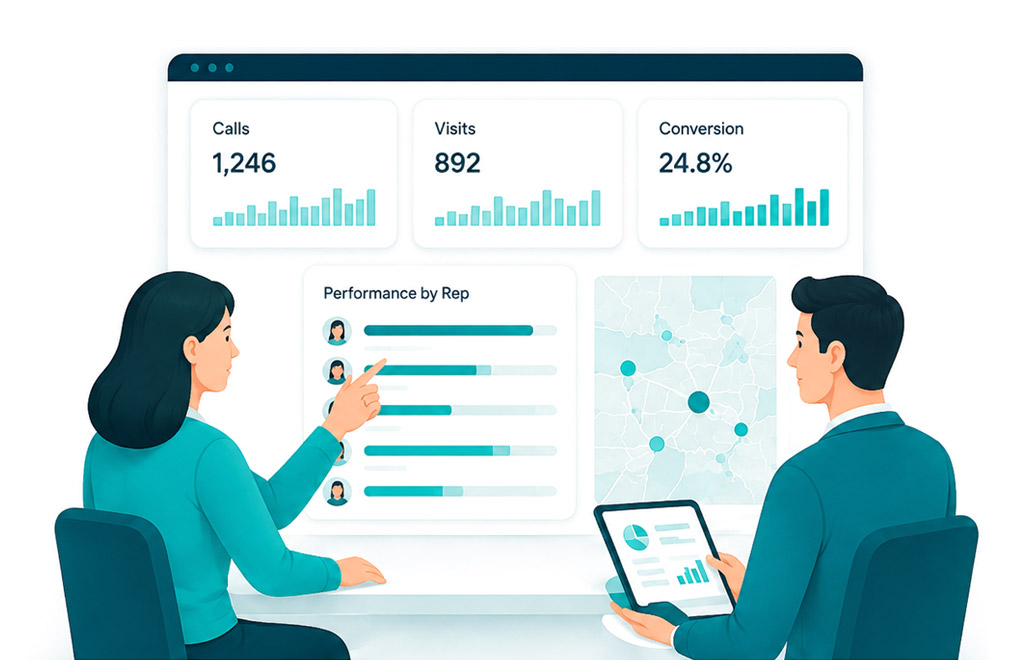
당사 제품의 처방·조제기관 현황을 영업 관점으로 분석합니다.

ATC 기준으로 관심 시장을 지속 모니터링합니다.

기준 항목과 조건을 조합해 병용처방 패턴을 분석합니다.
Find a drug by product name, ingredient or insurance code, then see prescription statistics, basic information and price history on its detail screen.
Follow AI Analyst, the Library and Drug search on real screens.
Basic comes as either a fixed-term pass or a subscription; the rest are subscriptions. If you request "Stop next payment" in Manage Subscription, you can keep using the service until the end of the period already paid; immediate cancellation and refunds for the remaining period are not available. Refunds required by law or the refund policy (such as refunds on termination during the contract period) can be requested through 1:1 inquiry.
KRW 39,000
/ 30 days · VAT included
For individuals exploring the market. Choose a fixed-term pass or a subscription.
KRW 199,000
/ billed every 30 days · VAT included
For frequent analysis and use with external tools.
KRW 600,000
/ billed every 30 days · VAT included
For teams that keep watching the market together.
Custom quote
/ by agreement
Scope and scale agreed per contract. Contact us and we will get back to you.
If you do not use the service within 7 days of payment, you will receive a full refund. Refunds are restricted once you have used the service, such as by viewing data.
Cancellations and refunds follow the refund policy. View refund policy
PhAI is built and operated by EDB Co., Ltd. We take demo requests, quotes and questions about data usage scope. After logging in you can also reach us through 1:1 inquiry in the account menu.